Equilibrium Diagrams
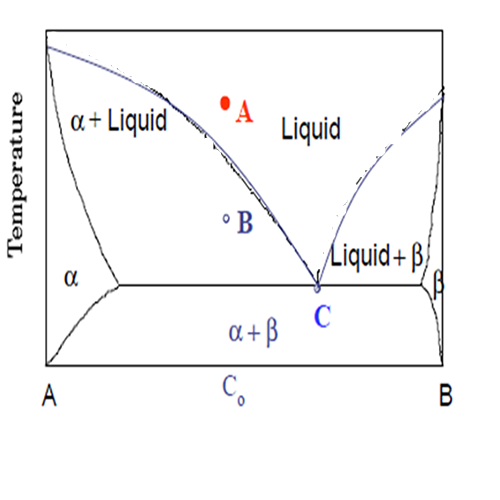
Equilibrium diagrams are graphs that show which phases are present in a material at equilibrium with its surroundings(fig.1). Properly interpreted an Equilibrium diagram shows in the number of phases that are present, their compositions and the relative amount of each as Phase functions of temperature, pressure, and overall composition of the material. Phases in a material have been defined in terms of microstructure, as regions that differ from one another either in composition or in structure, or both.

The Phase Rule
After Gibbs Phase Rule, a relationship between the number of Phases (P) that can coexist at equilibrium in a given system, the minimum number of components(C) that can be used to form the system, and the degrees of freedom (F).The relationship may be stated in equation form as
P + F = C + 2
Example: Use the Phase rule for the Points of A, B and C in the figure 1, when pressure is constant. The above equation is:
P + F = C + 1
For Point A, the degree of freedom (F) is:
C is 2 because of A and B, P is 2 because of liquid and α, therefore, F= C +1 – P = 2+1-2 = 2, it means we can change 2 parameters Temperature and composition.
For Point B, the degree of freedom is:
C is 2 because of A and B, P is 2 because of liquid and α, therefore, F= C +1 – P = 2+1-2 = 1, it means we can change only one Parameter Temperature or composition.
For Point C: C= 2 (A and B) P = 3 (liquid and α and β), therefore F = C +1 – P = 2 + 1 – 3 = 0 ,it means we cannot change any phase in this point of diagram.

