Binary Diagrams
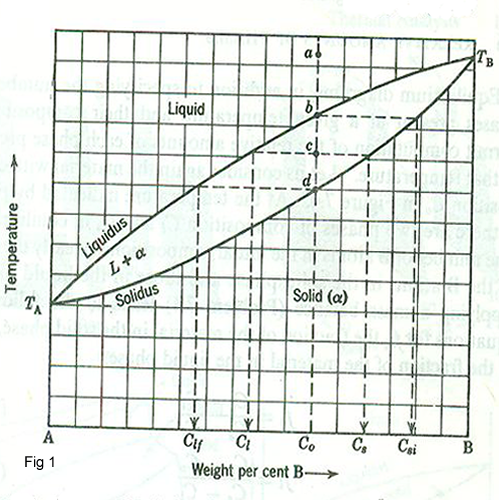
In binary diagrams, temperature is plotted as the ordinate with composition as the abscissa. Figure 1 shows a schematic solid solution diagram between two components, A and B, which are completely soluble in one another. The diagram is composed of a single-phase liquid region, a single phase solid region, and a two phase liquid plus solid region. we consider an alloy with composition C1 in the equilibrium diagram figure 1.If this alloy is at equilibrium at the temperature corresponding to point a, it is a single phase liquid of composition C1;if it is then cooled slowly to point b, the initial solid to form is of composition Cgi. On further cooling to point C1, the alloy consists of solid of composition Cs in equilibrium with liquid of composition Cl. Upon further cooling to point d, the final composition is Clf.At any temperature below the point d, the alloy is completely solid.

Relative Amounts of Phases
Equilibrium diagrams in addition to specifying the number of phases present at a given temperature and their composition, permit computation of the relative amount of each phase present at that temperature.
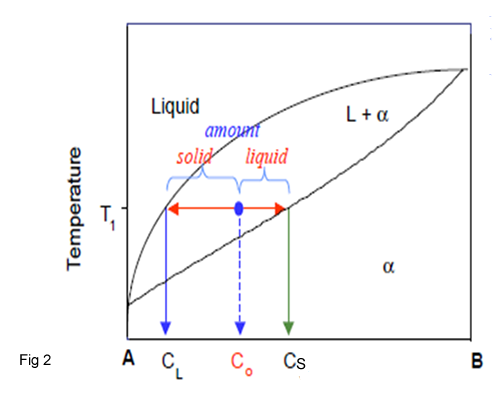
At the temperature indicated by point C0 , there are two phases of composition CL and CS in equilibrium(fig 2). The number of B atoms in the initial compositions is clearly the sum of the B atoms in the solid phase and those in the liquid phase. The following equations for, fs is the fraction of the material in the solid phase and fl, the fraction of material in the liquid phase.
fs = C0 - Cl/Cs -Cl
fl = Cs –C0 /Cs -Cl

Example:
Calculation of phase amount of AB, when Co=35%B,CL = 10% B and Cs=45%B,then an overall composition of 35%AB at T1 is:
Liquid amount = (45 -35)/(45 -10) = 0.286 (28%)
Solid amount =( 35 – 10)/(45 -10) = 0.714 = 0.714 (71%)

