Mechanical Tests
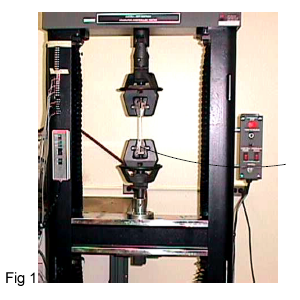
The fabrication and use of materials depend in large measure on such mechanical properties as strength, and ductility. The properties can be obtained from standard types such as tensile, hardness and fatigue tests. The capacity of a material to withstand a static load can be determined by testing that material in tension or compression(fig 1).
Tensile Test
In this test (figure 1), the sample is elongated in uniaxial tension at a constant rate, and the load necessary to produce a given elongation is measured as a dependent variable. Stress-Strain Diagram is determined by tensile test

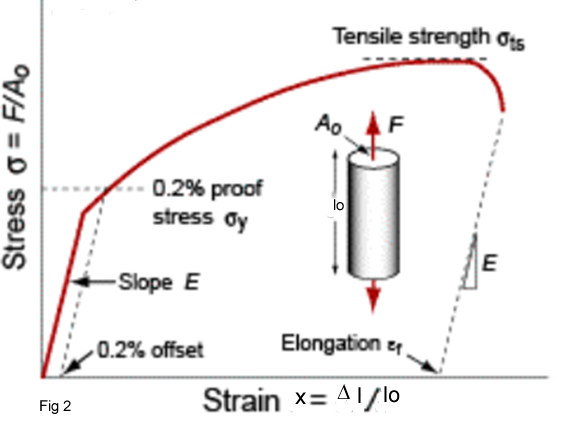
Figure 2 shows the Stress-Strain Diagram which is a relationship between a load applied to a material and the deformation of the material, caused by the load.

Strain(x)
A load elongation curve may be plotted from the results of a tension test. A specimen is fixed in the machine and its length is normally lo= 5D. A calibrated distance between two marks on the specimen surface is continuously measured until the rupture. The strain is calculated according the following equation:
x = l –lo/lo *100 =∆l/lo*100
Tensile stress
It is the ratio of the tensile load F applied to the specimen to its original cross-sectional area Ao:
∂ = F/Ao
F = Tensile load,Ao = Cross – sectional area
Tensile strength
The relation between stress and strain in the elastic region is linear for metals and ceramics and is described by Hooke's low:
∂ = E * x
Where E is a constant, known as Young's Modulus or Modulus of Elasticity. The value of Young's Modulus is determined mainly by the nature of the material and is nearly insensitive to heat treatment and composition.
Yield strength
It is the maximum stress that can be developed in a material without causing plastic deformation. It is the stress at which a material exhibits a specified permanent deformation and is a practical approximation of the elastic limit. It is very difficult to determine the yield point; therefore it is to define a deformation about 0.2 percent. At the Stress – Strain Diagram.we can draw a line parallel with the modulus slope with 0.2% offset, the stress/strength at the intersection with the graphs will be the 0.2% yield strength.

